News
Counterclockwise: smartphone battery endurance has doubled since 2010
Date: 01-30-2018 Click: 2734We’ve looked at smartphone batteries before, but that was just the raw capacity. As you well know, the size of the battery is not the only measure of how long you can go between charges. Our battery test gives a more realistic result so let’s chart that.
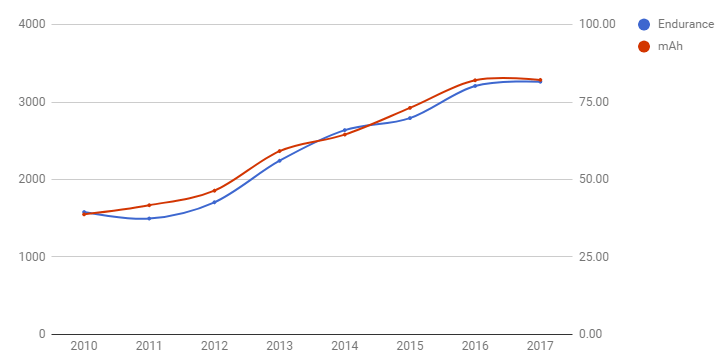
We suspected that with each year, the Endurance rating will grow but also that newer phones will get better Endurance per mAh. As you can see from the chart below the former is true, the latter is not.

Counterclockwise: smartphone battery endurance has doubled since 2010
Starting at around 40 hours between charges for a 2010 phone, the average 2017 phone can get double that. And it has been a fairly steady growth – keep this up and by 2024 the average phone might last 160 hours.
The average phone. Even today there are outstanding individuals (like the Lenovo P2) that can do 150 hours or so. But they are the outliers, the majority of phones today can’t cross the 100 hour mark.
Efficiency has not increased, really. We tried plotting it but it turned out to be a boring chart as it was basically flat. We did find this interesting, though — the average phone gets about a minute and a half per milliamp hour of battery.
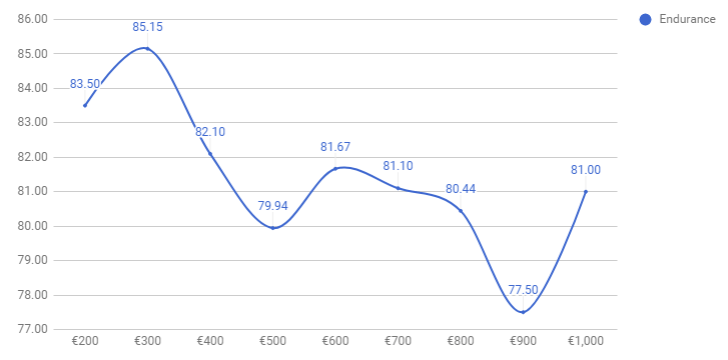
We’ll close this off with a bit of shopping advice. We took the phones from 2017 and plotted their average Endurance rating per price category. We only did it for last year’s phones because prices for anything older are unreliable (depends on region, availability and so on).

The conclusion seems pretty obvious – more money does not always buy you better battery life. If you want battery bang for your buck, the €300 segment is the sweet spot. These phones tend to have solid mid-range chipsets too, so you won’t be slumming it with a glorified calculator.
All info from: https://www.gsmarena.com/counterclockwise_smartphone_battery_endurance_has_doubled_since_2010-news-29334.php


